Mamby: Crafting a creator dashboard to measure post success
WEBAPP
2021-2023
IN-HOUSE PROJECT

HYPOTHESIS 1
Empowering creators with a decision-making tool for their creations can lead to a remarkable improvement in content quality, subsequently attracting a larger audience of visitors. By utilizing this tool, creators can make informed choices, refining and optimizing their content to resonate better with their audience. As a result, an influx of engaged visitors is likely to be drawn to their high-quality creations, fueling growth and success on the platform.
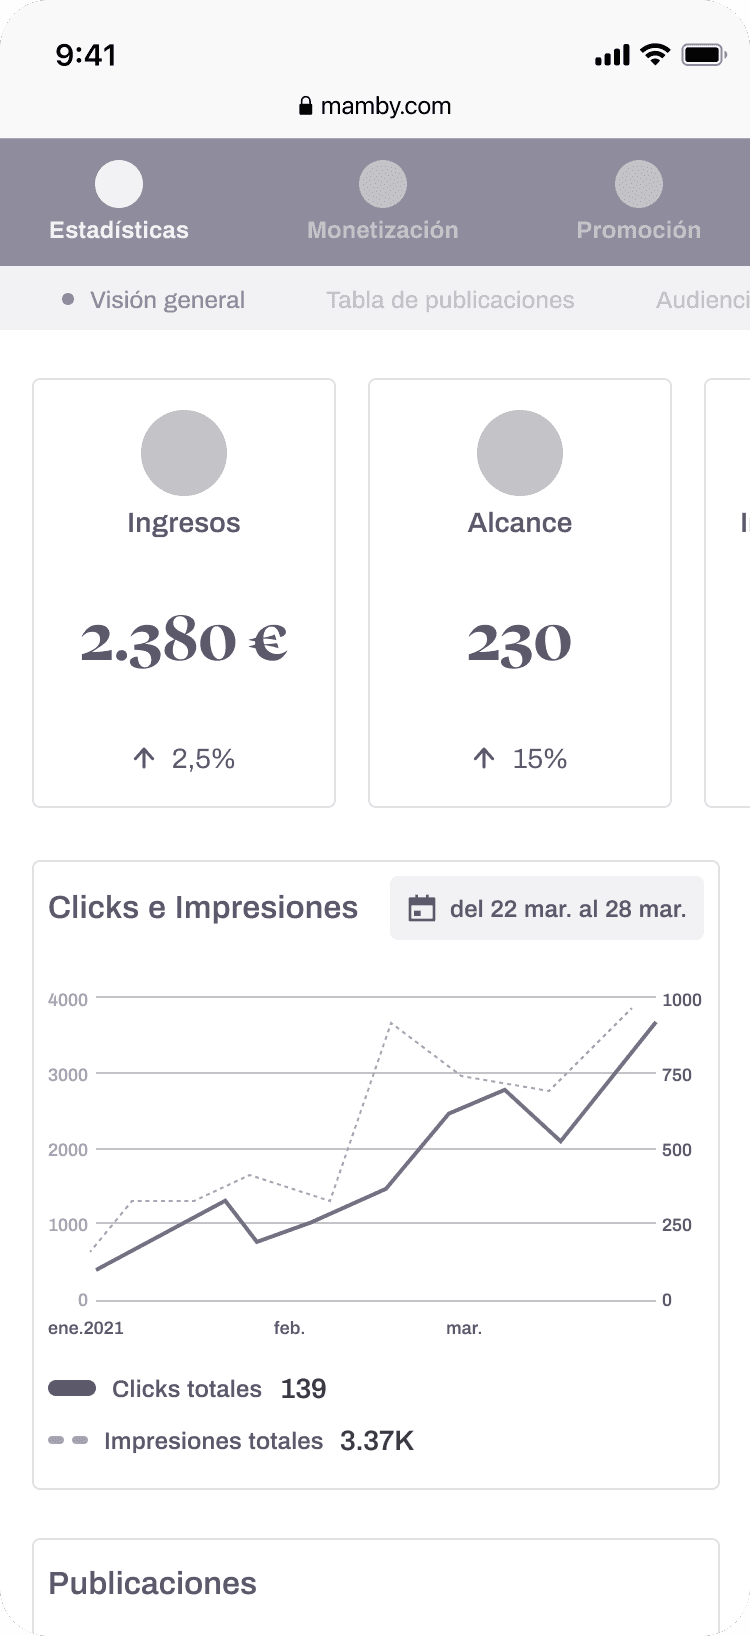
STATS
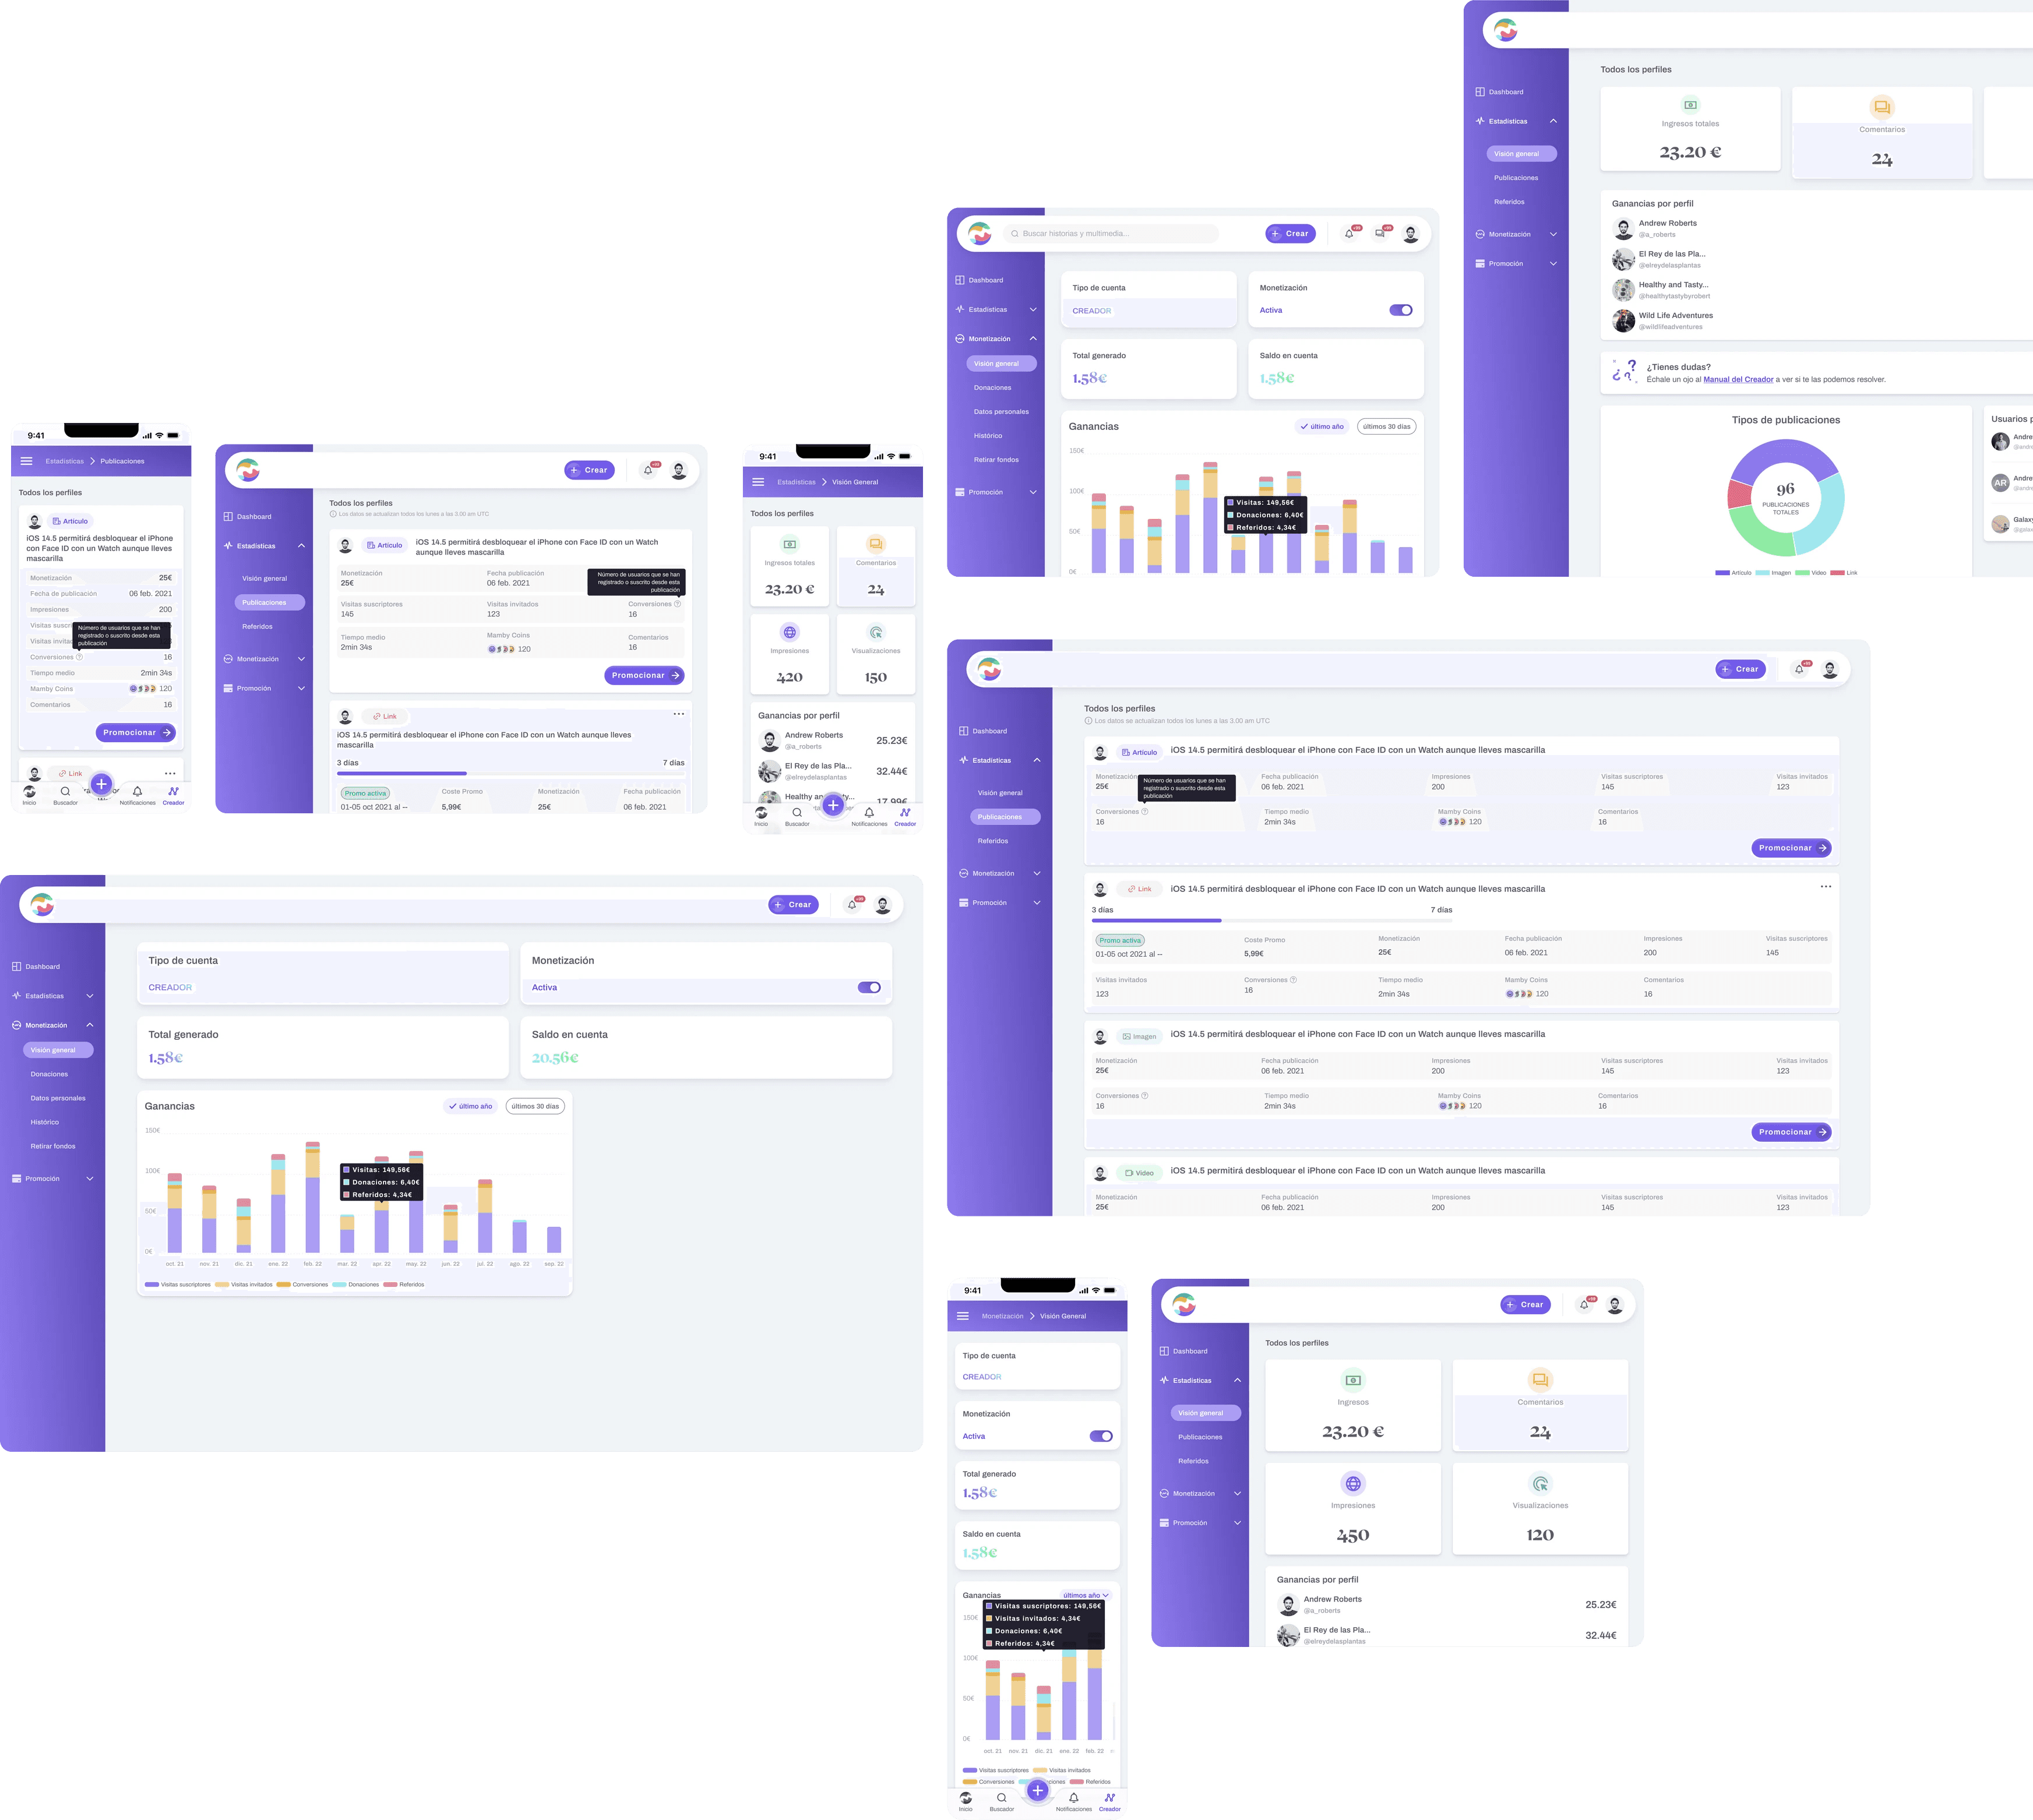
In our initial approach, we introduced three views: one for account information, another for post performance, and a third for the general audience. As we progressed, we continuously adapted our monetization approach to address emerging needs and challenges. We discovered that users' decisions regarding their content creation are significantly influenced by its potential monetization. Consequently, we have prioritized data focused on enhancing this.
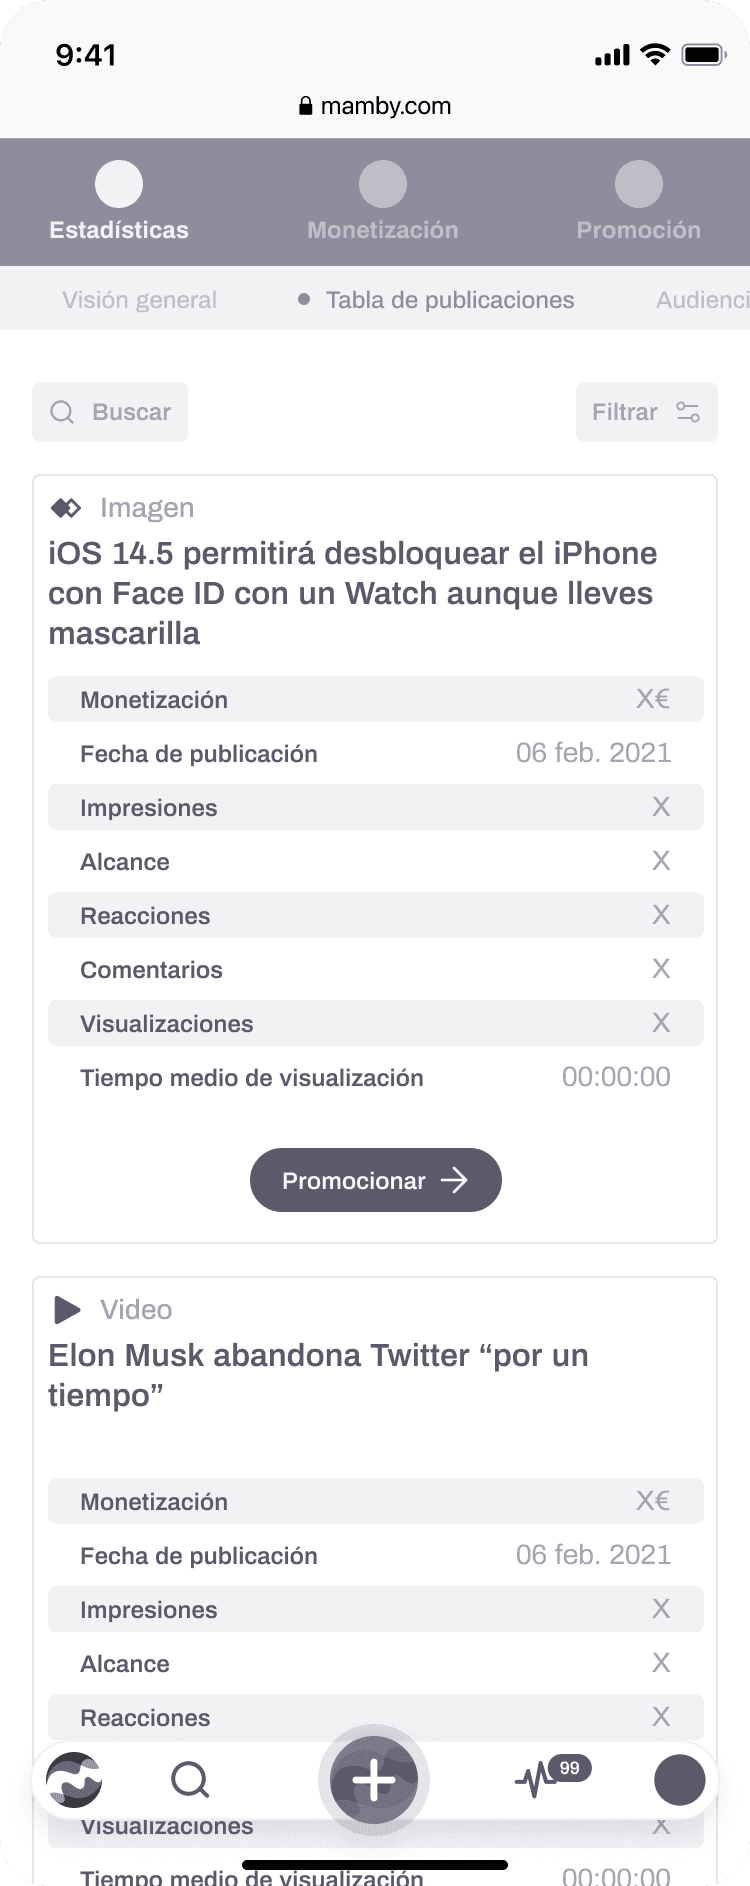
POST TABLE
Within this second view, users gain valuable insights into the performance of each post, enabling them to discern how to enhance its impact by assessing received interactions. This empowers users to optimize their content strategy for greater engagement and effectiveness.
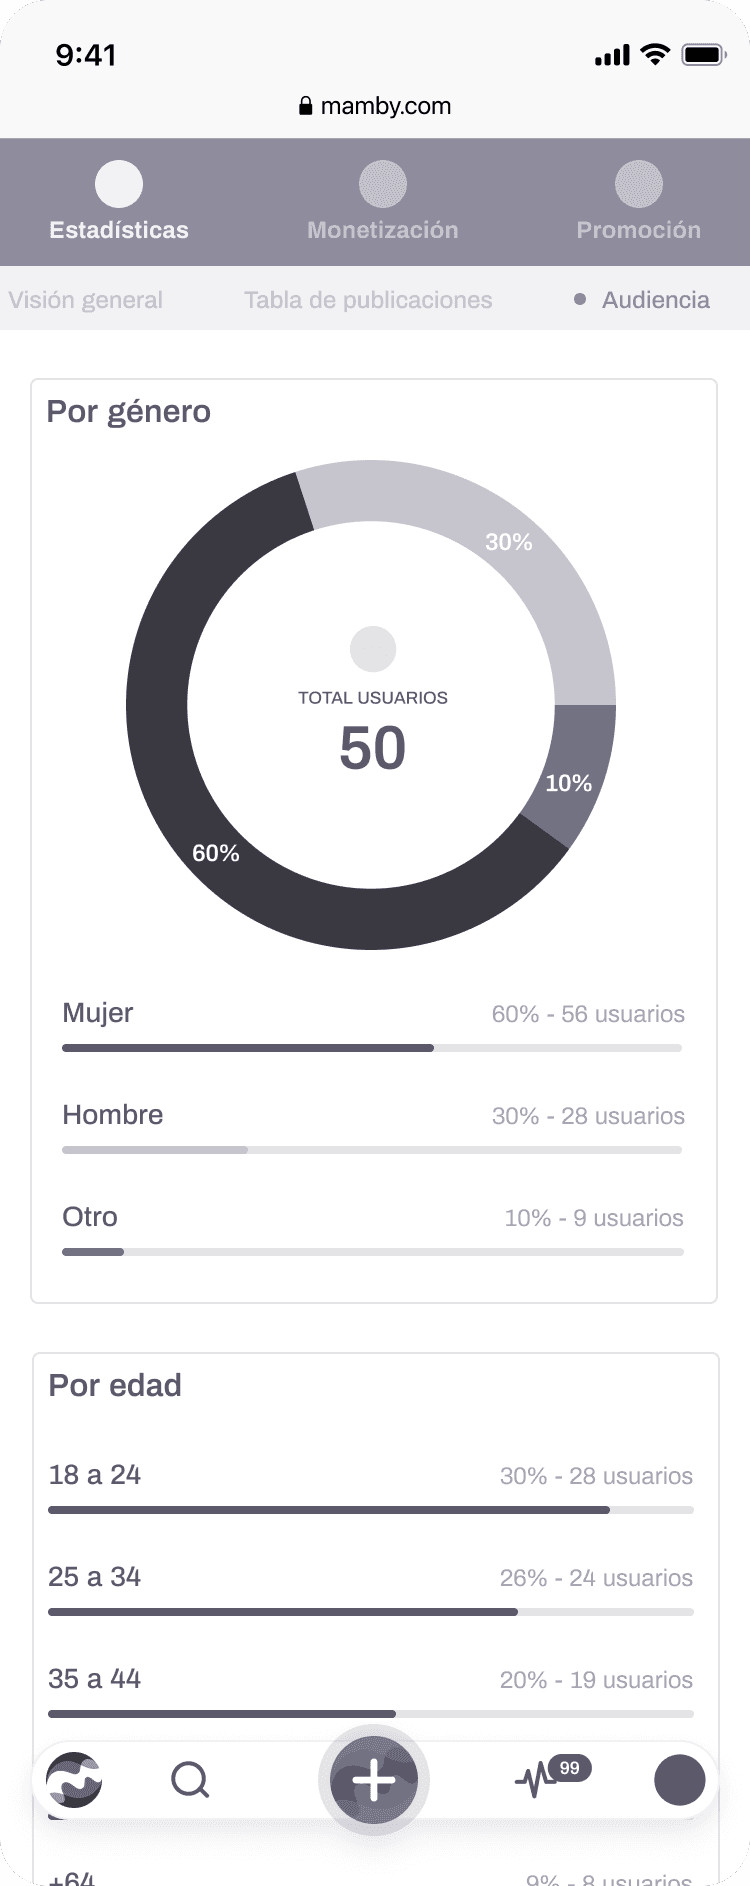
AUDIENCE
In the third view, we aimed to collect audience information, allowing users to understand their user demographics, such as age range, gender, device usage, and geographic origin. However, upon conducting a usability test and assessing its complexity with the development team, we have decided to postpone its implementation for now.
PROCESS
This feature undergoes continuous improvement and review, with a positive impact on creator behavior. For instance, when we introduced the 'Visitors View' (tracking views from external links), creators experienced a remarkable increase in content sharing across various social media platforms.
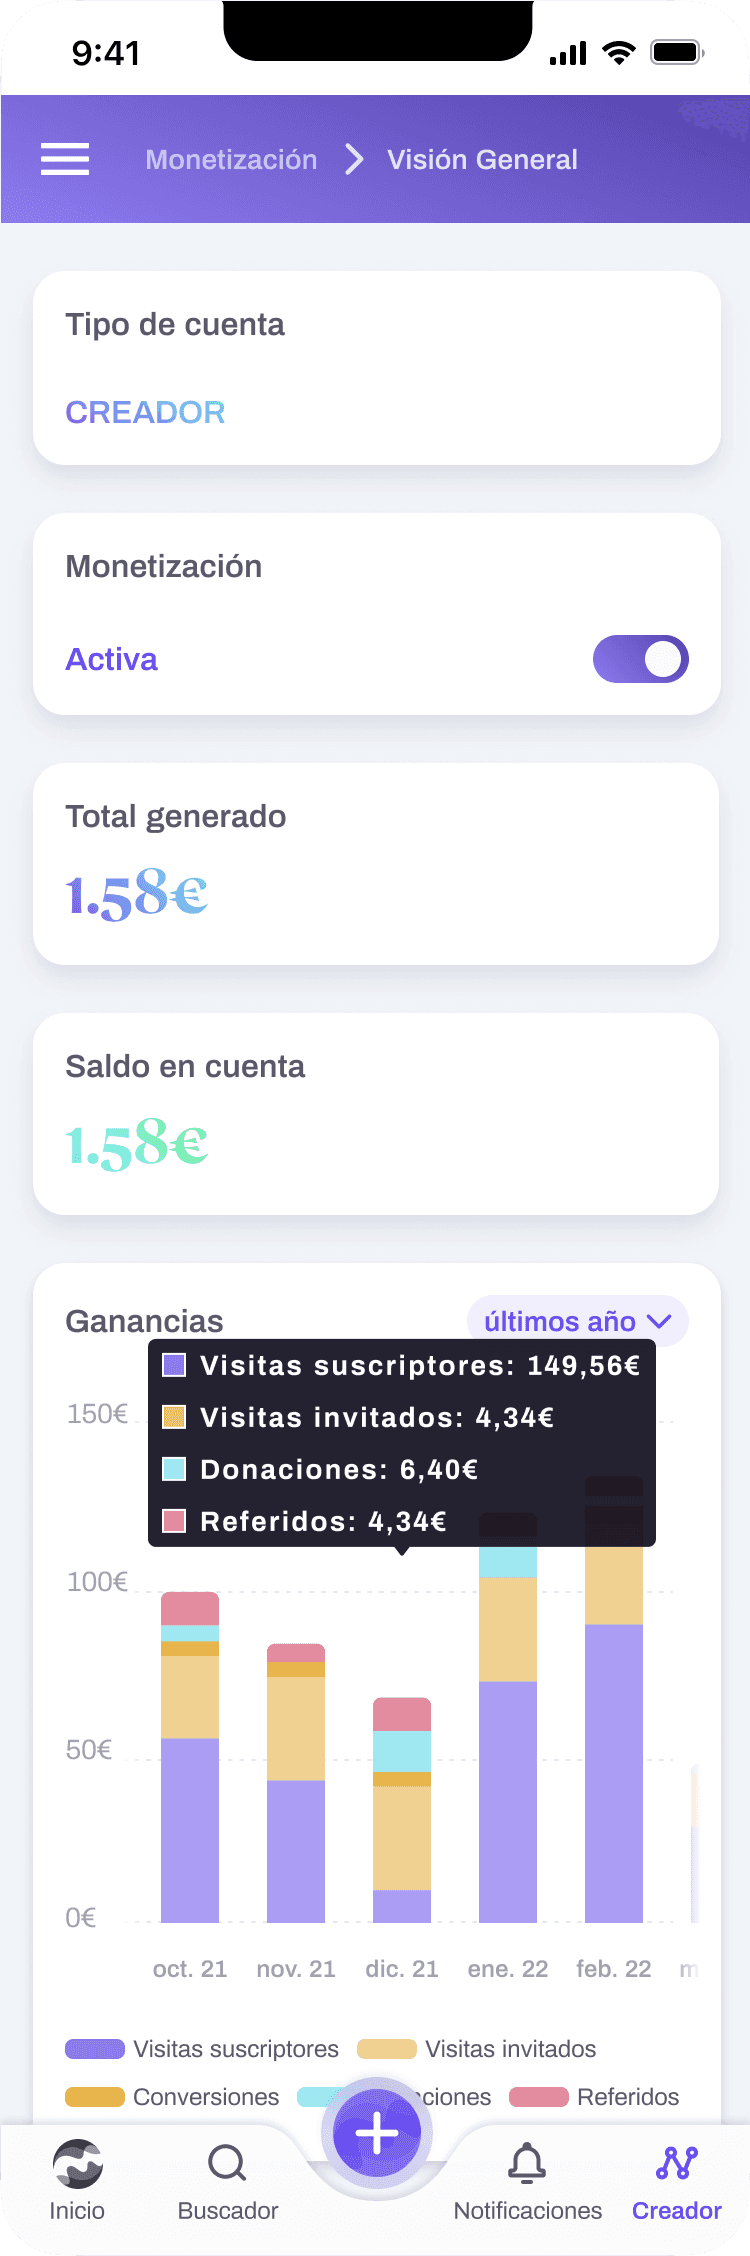
MONETIZATION SECTION
In the latest iteration, we introduced a dedicated monetization section featuring an insightful graph. This graph allows users to visualize the various sources of their monetization, including subscriptions, external visitors, referrals, and donations. This addition provides creators with a clear overview of their revenue streams and empowers them to make informed decisions to further enhance their monetization strategies.
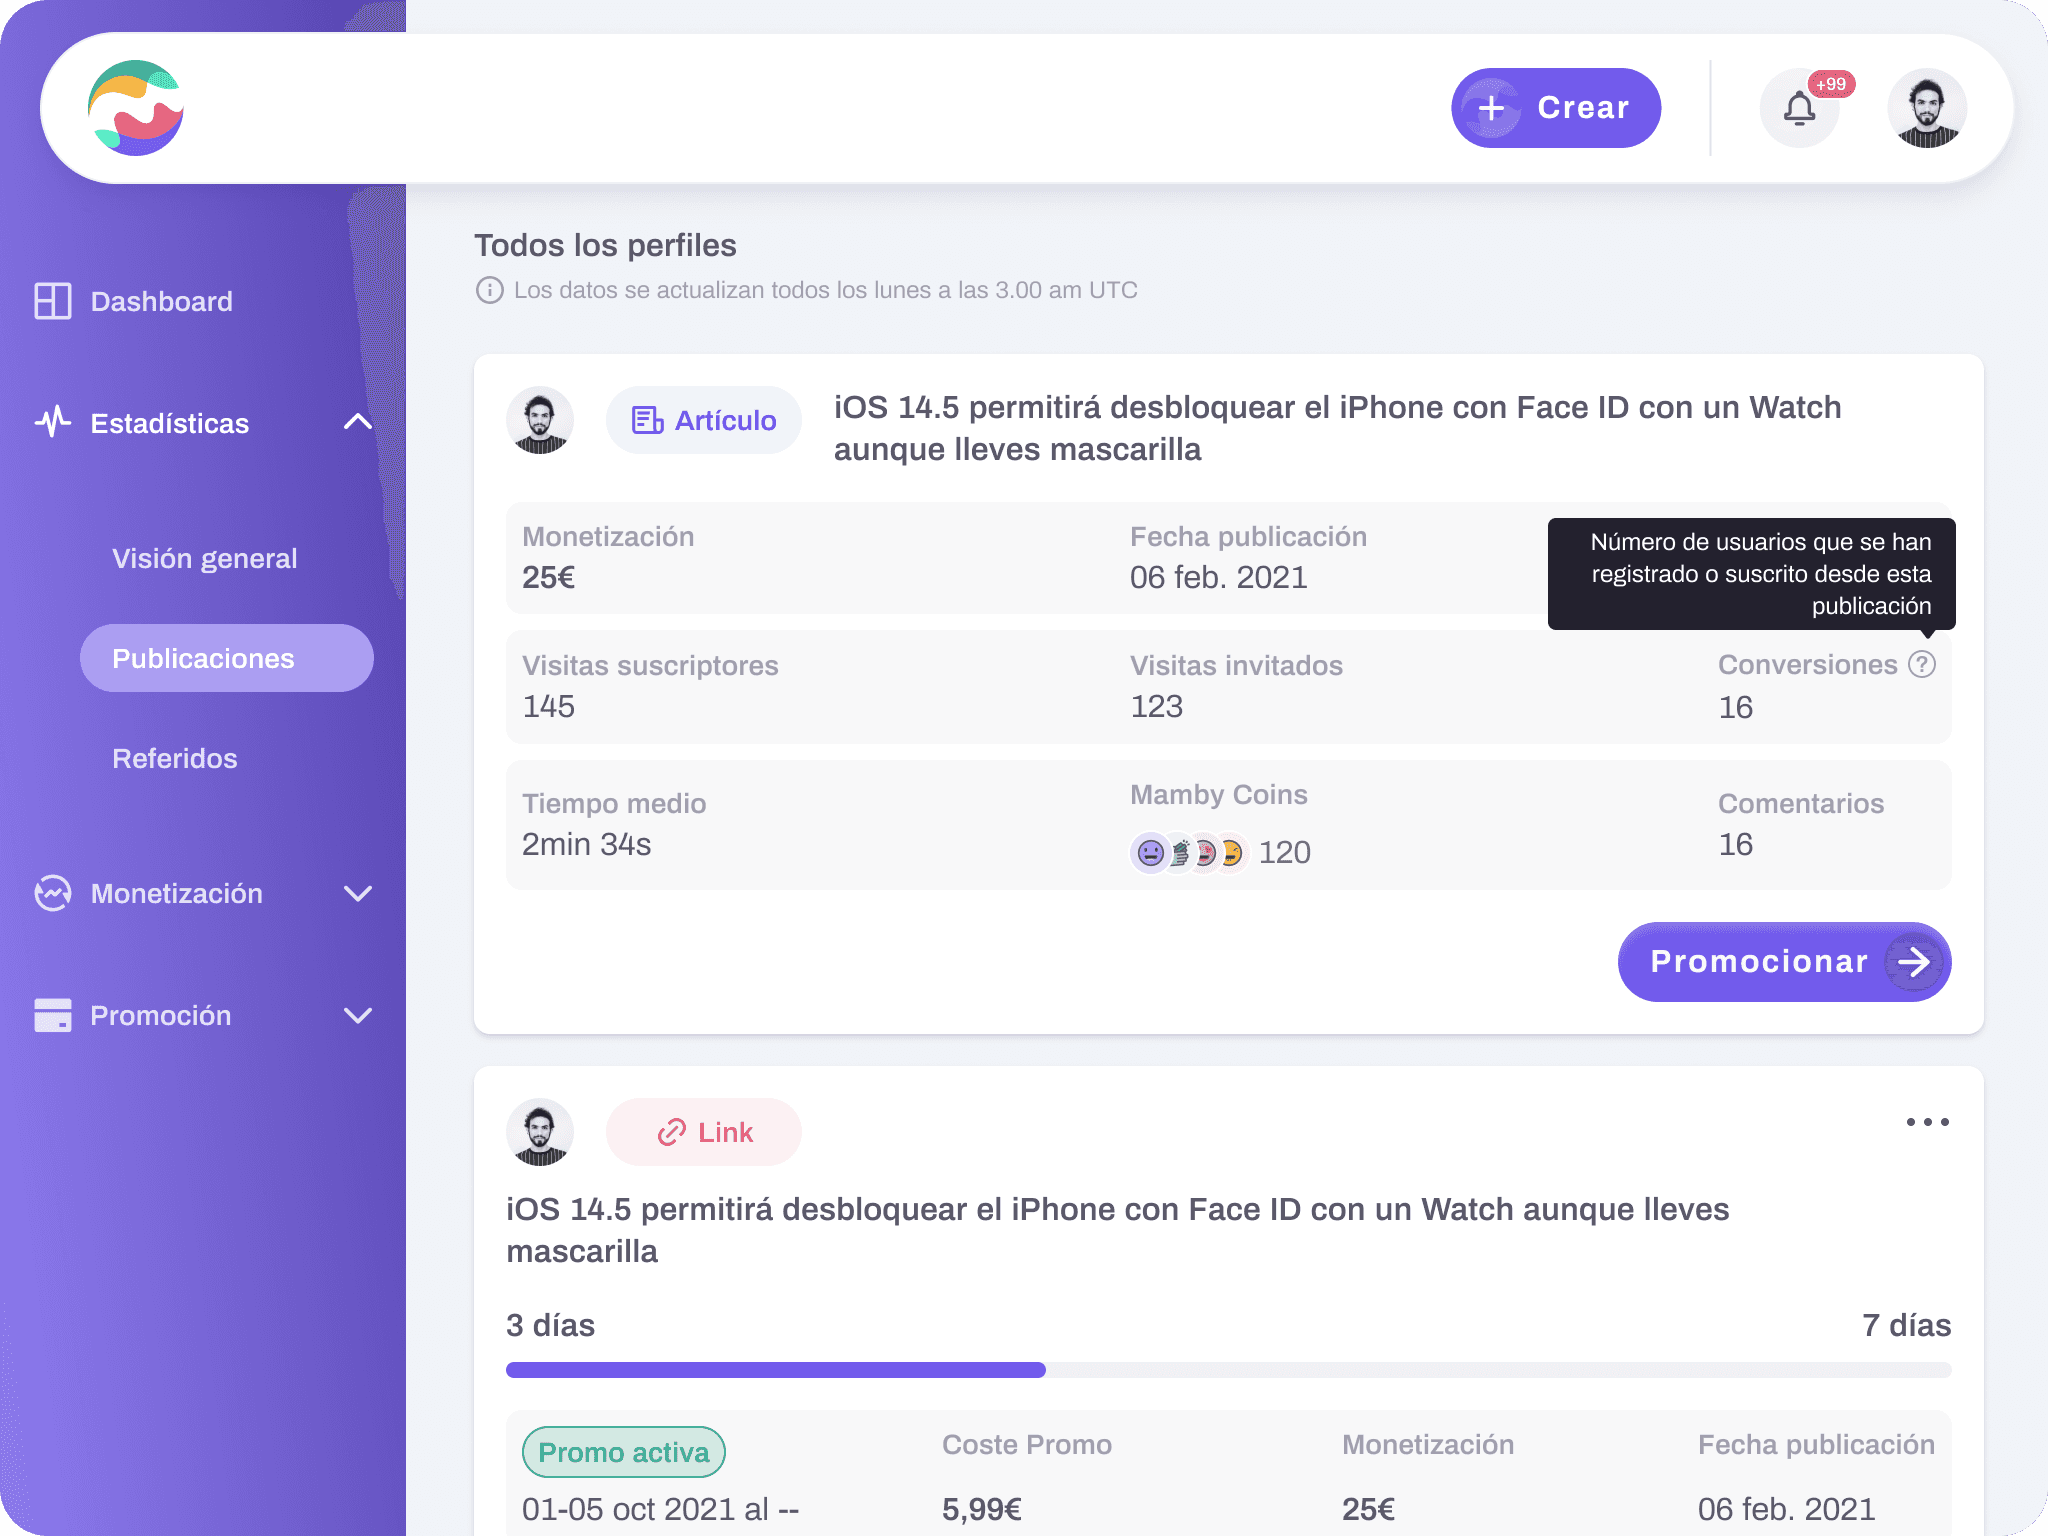
POST TABLE
To encourage users to share their content on other platforms, we introduced a compensation system for posts that drive new registrations or subscriptions. We made this parameter visible on each post stats, allowing users to easily identify which type of content has been most successful in attracting new audiences and driving conversions. This transparency empowers creators to tailor their content strategy and maximize their impact across various media.
MEASURING DECISIONS
With each new implementation, we closely monitored its impact on the analyzed data. Let me share some of the most significant findings we've observed after the latest iteration.
DATA
Popularity Index (based on views and interactions)
DATA
+70%
Monthly user retention rate
Use article post type
DATA
+15%
Sharing content by creators